All solutions
Reporting
Satisfaction reporting
Automated surveys after every closed ticket, on a live dashboard.
What it does
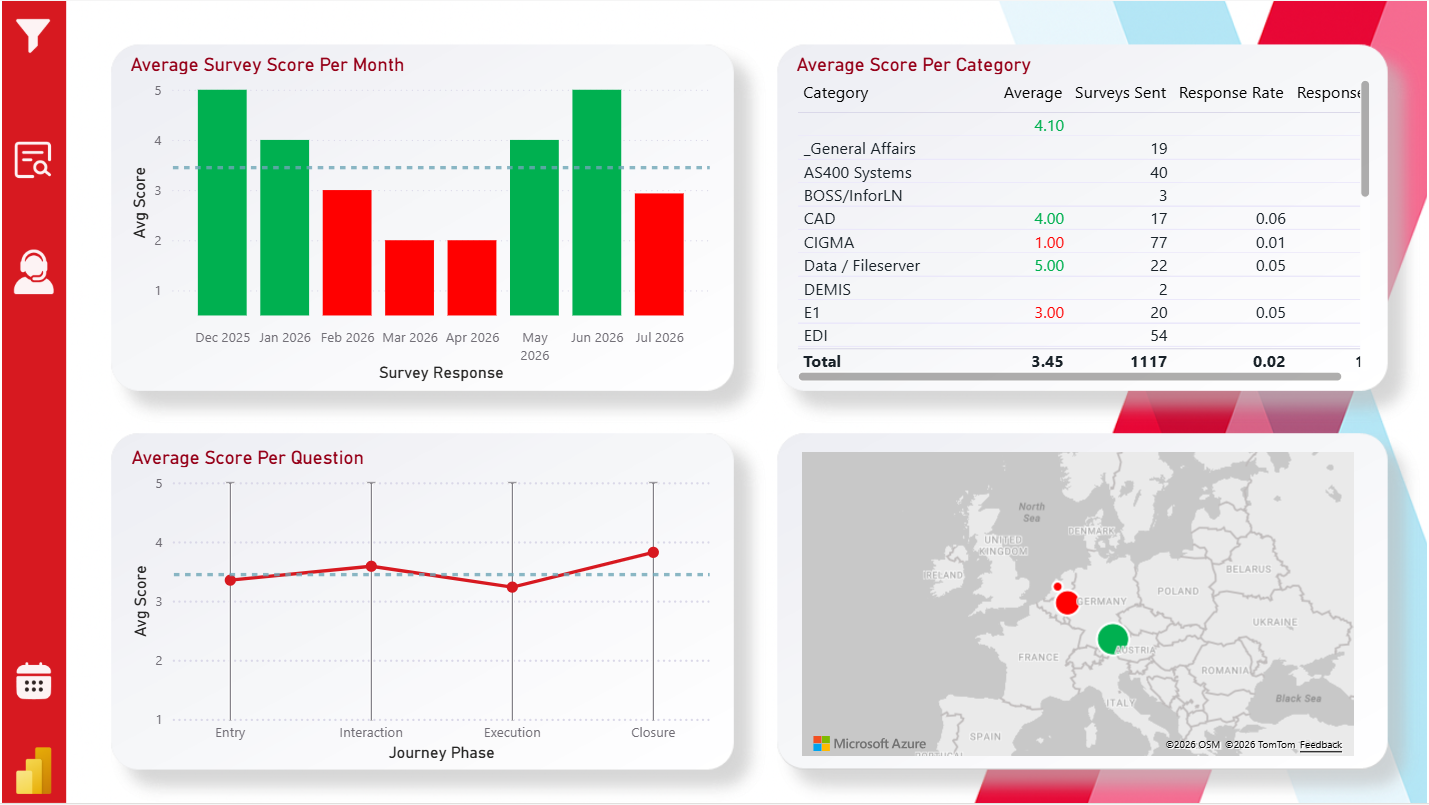
Measuring support quality meant sending surveys by hand and pasting results into a spreadsheet. This runs on its own: after every closed ticket a short survey goes out, the replies land in one place, and a dashboard shows the monthly satisfaction score and response rate — so the trend is visible without anyone building a report.
How it works
- Surveys dispatched automatically when a ticket closes
- Responses collected and de-duplicated in one place
- A live dashboard scoring satisfaction month by month
More from this project
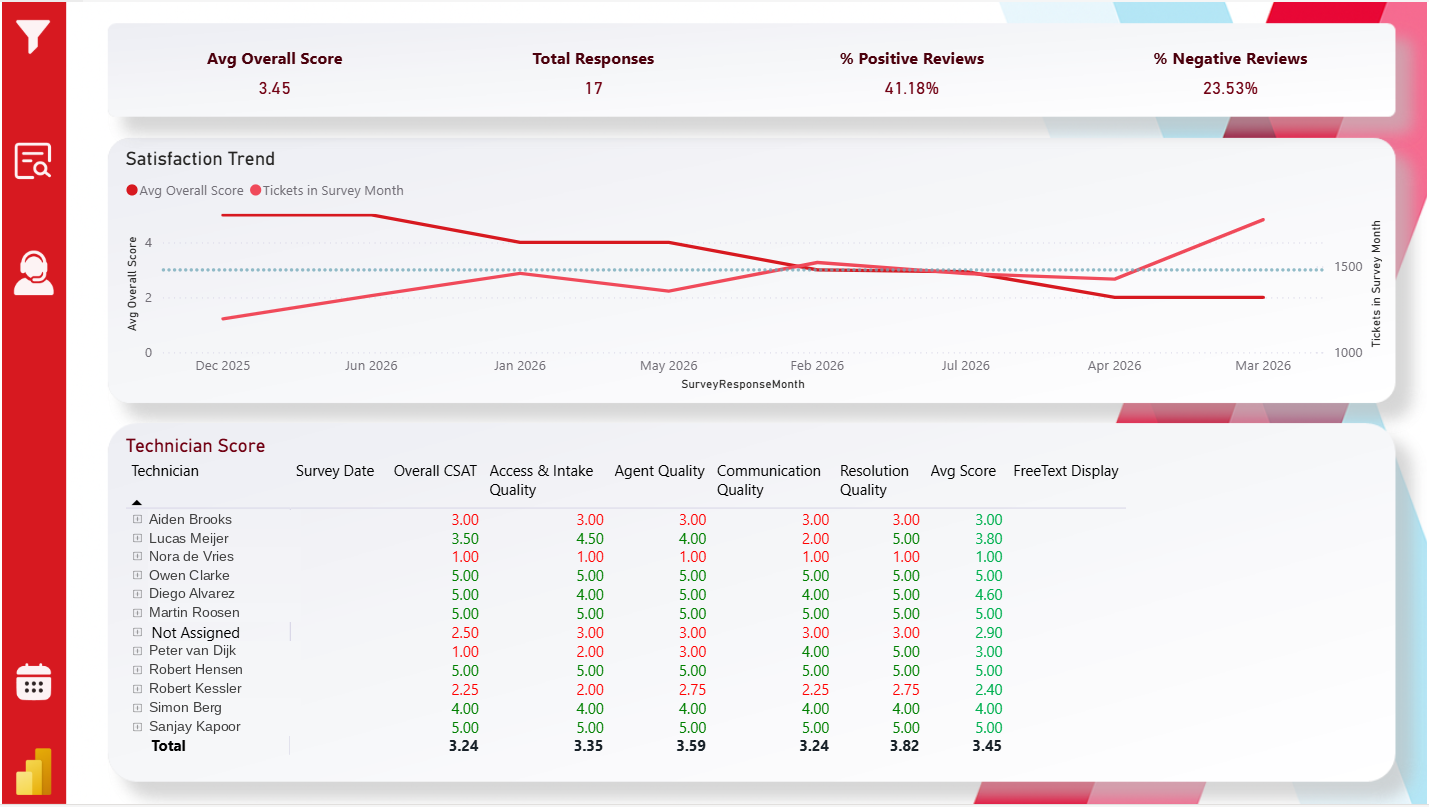
Per-technician satisfaction scores and the response-rate trend over time 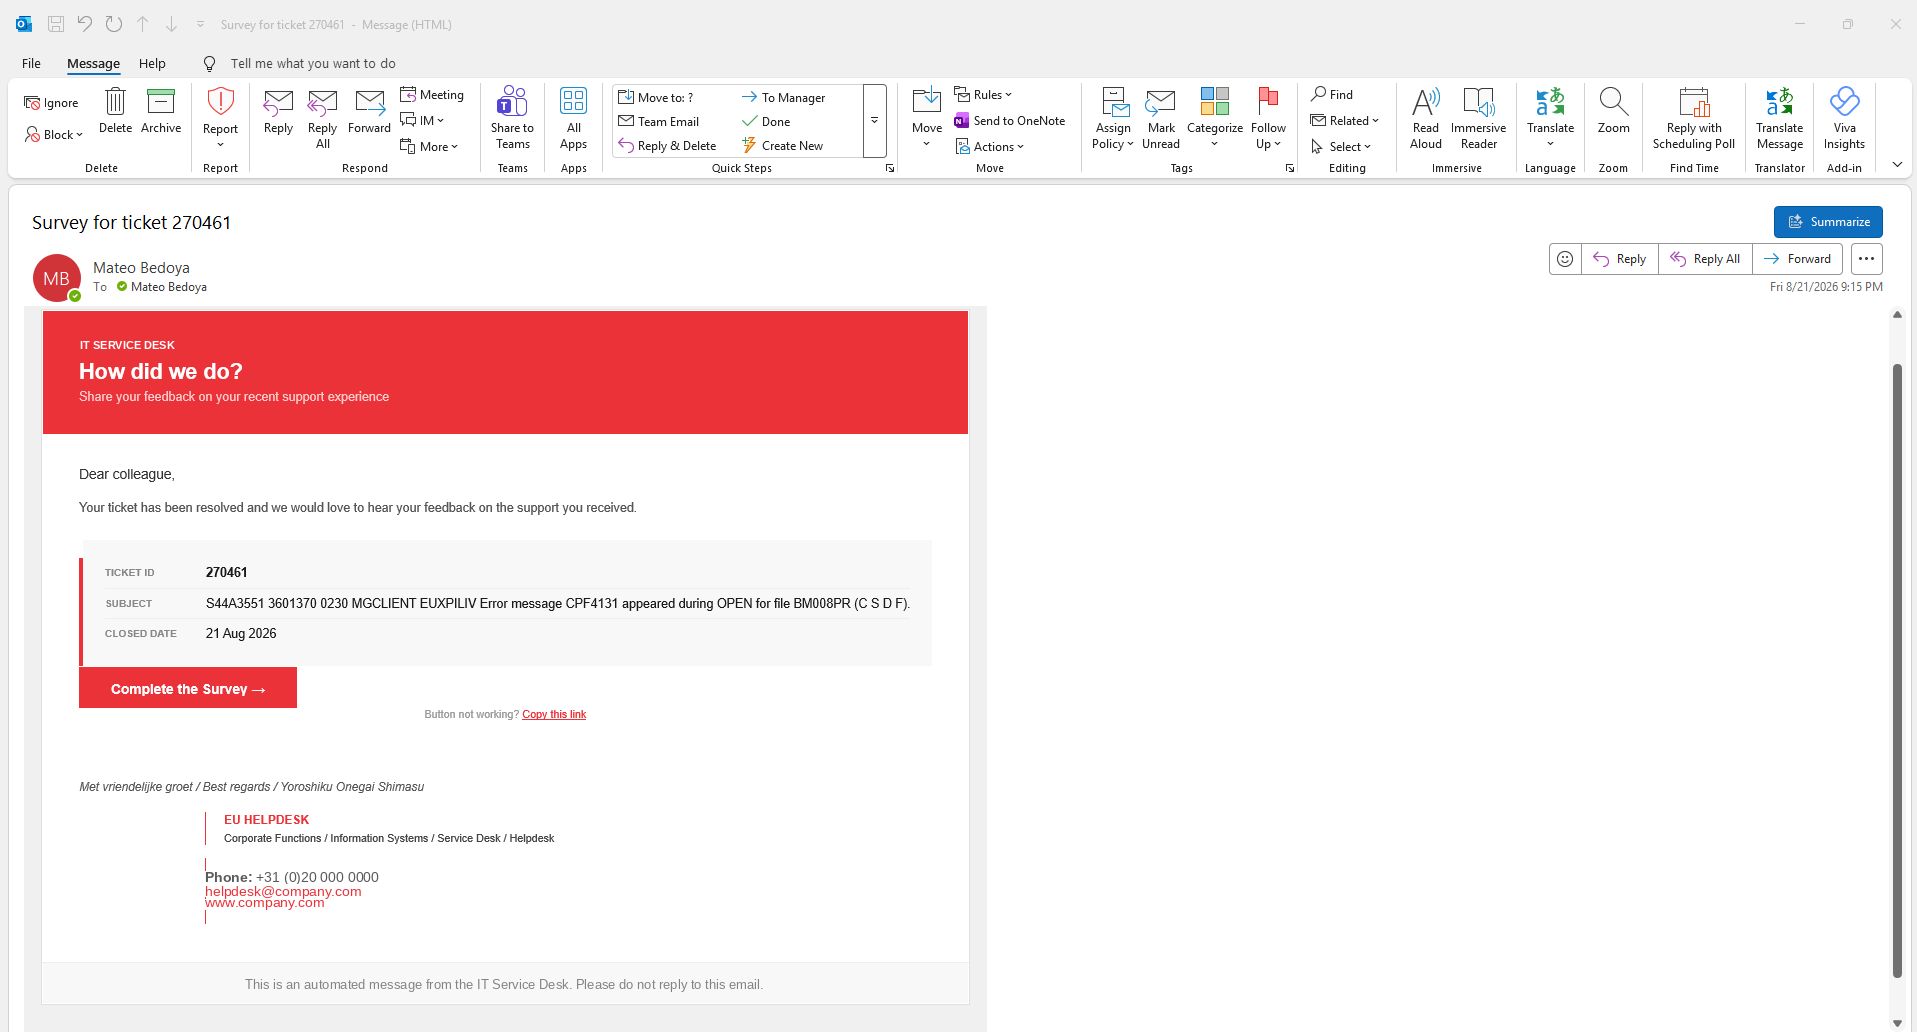
The survey email sent automatically after a ticket is closed 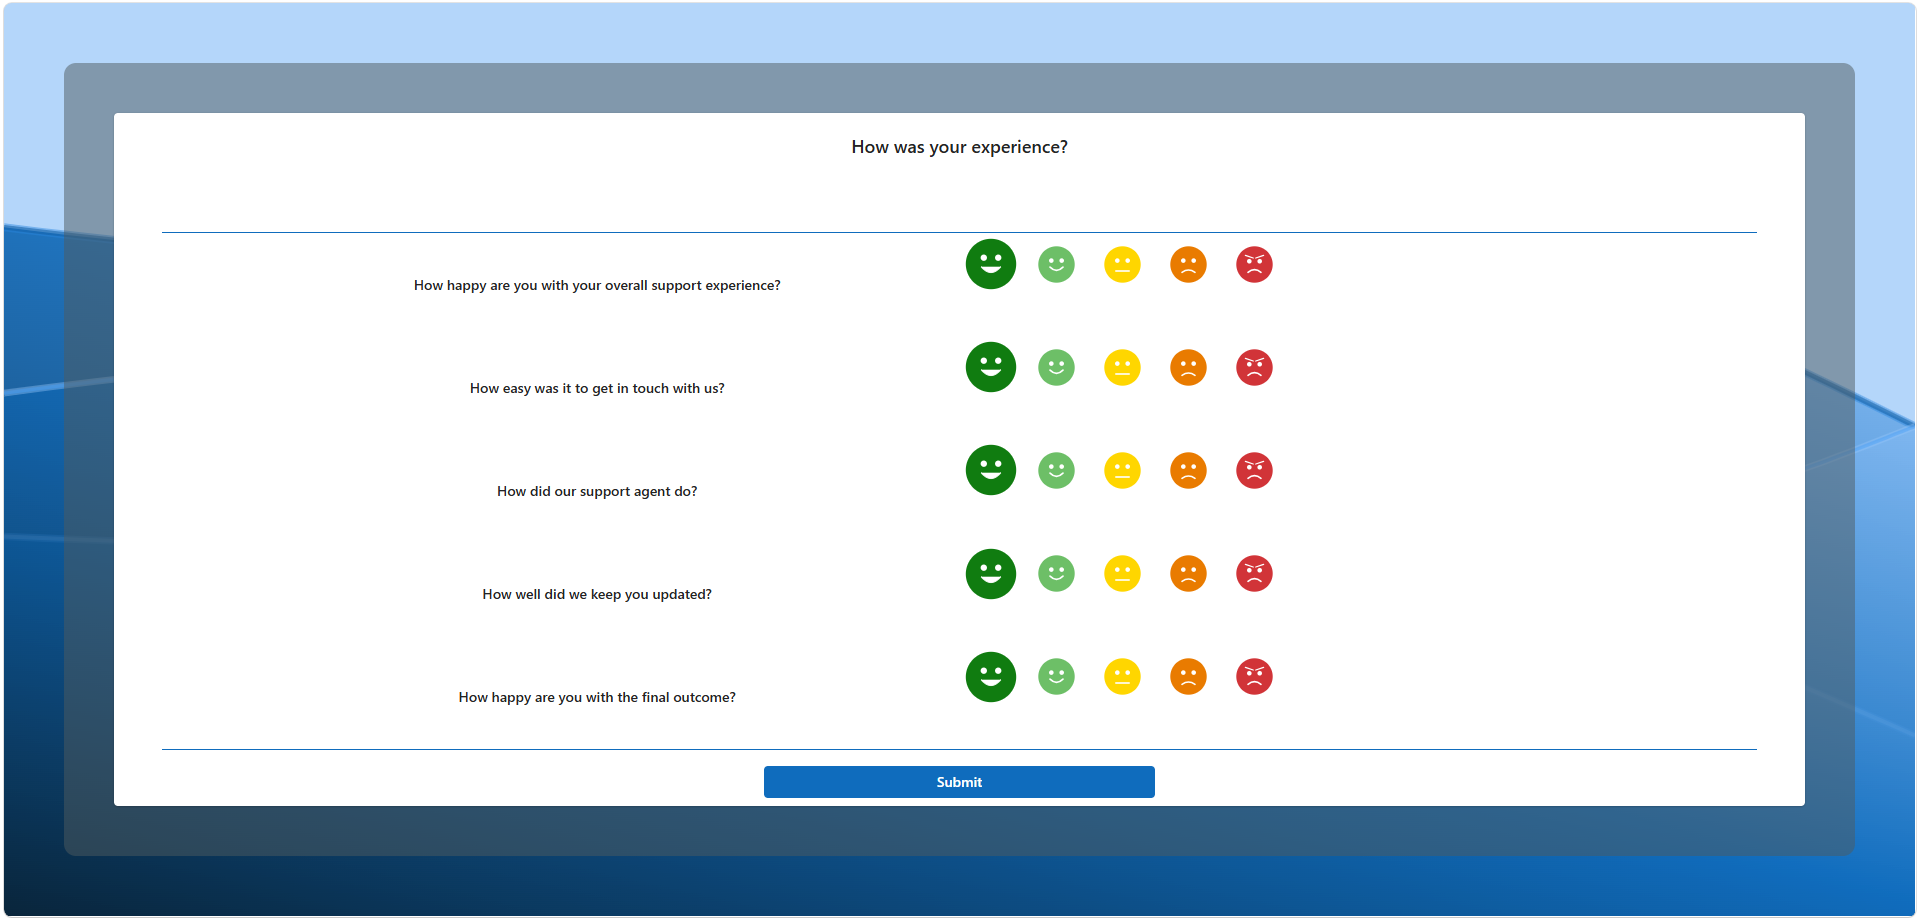
The five-question survey form users complete in one screen
Something in your week looks like this?
Tell us what it is. We'll say honestly whether it's worth automating.
Book a call